Portfolio
📊 Data Analytics Portfolio - R. Nagarjuna
Welcome to my Data Analytics Portfolio!
Here you’ll find my end-to-end projects showcasing skills in SQL, Python, Power BI, and Excel, solving real-world business problems with data-driven insights.
📄 Resume
📥 Download: R_Nagarjuna_Resume.pdf
🚀 Projects
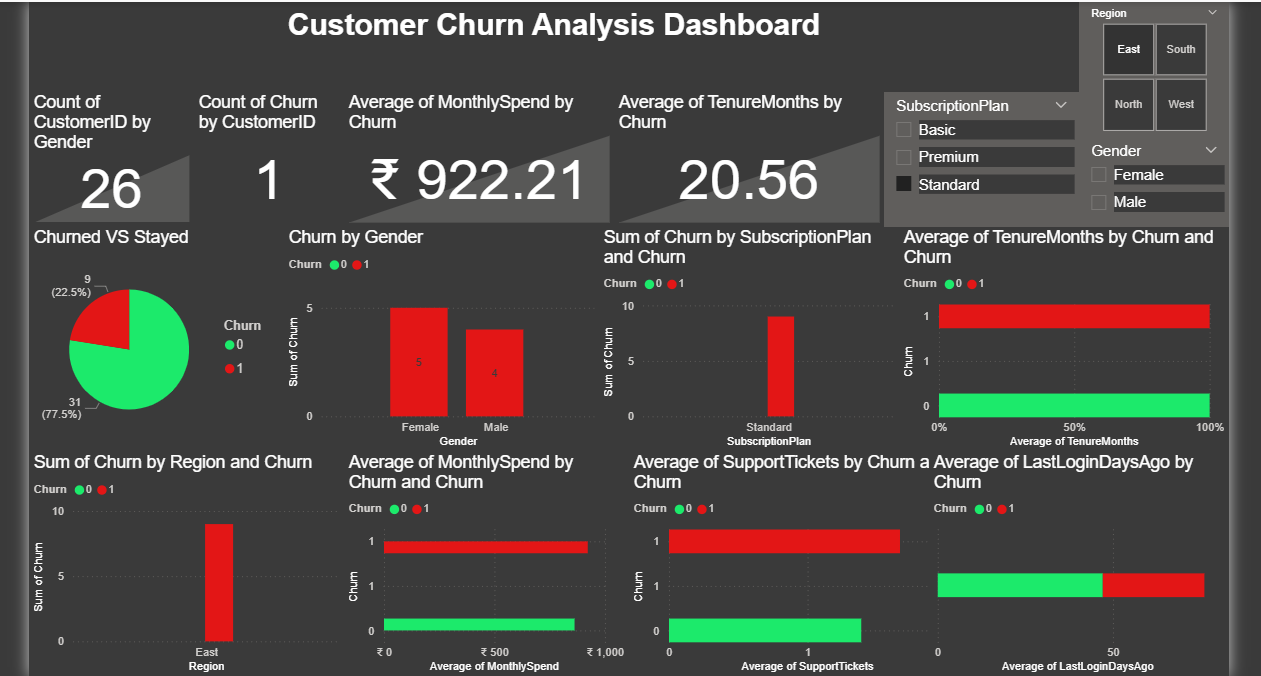
1️⃣ Customer Churn Analysis
Tools & Skills: Python (Pandas, NumPy, Matplotlib, Seaborn), Machine Learning (Logistic Regression, Random Forest)
Highlights:
- Analyzed telecom customer data to identify churn patterns.
- Built predictive models to classify high-risk customers.
- Suggested actionable retention strategies.
Screenshot:
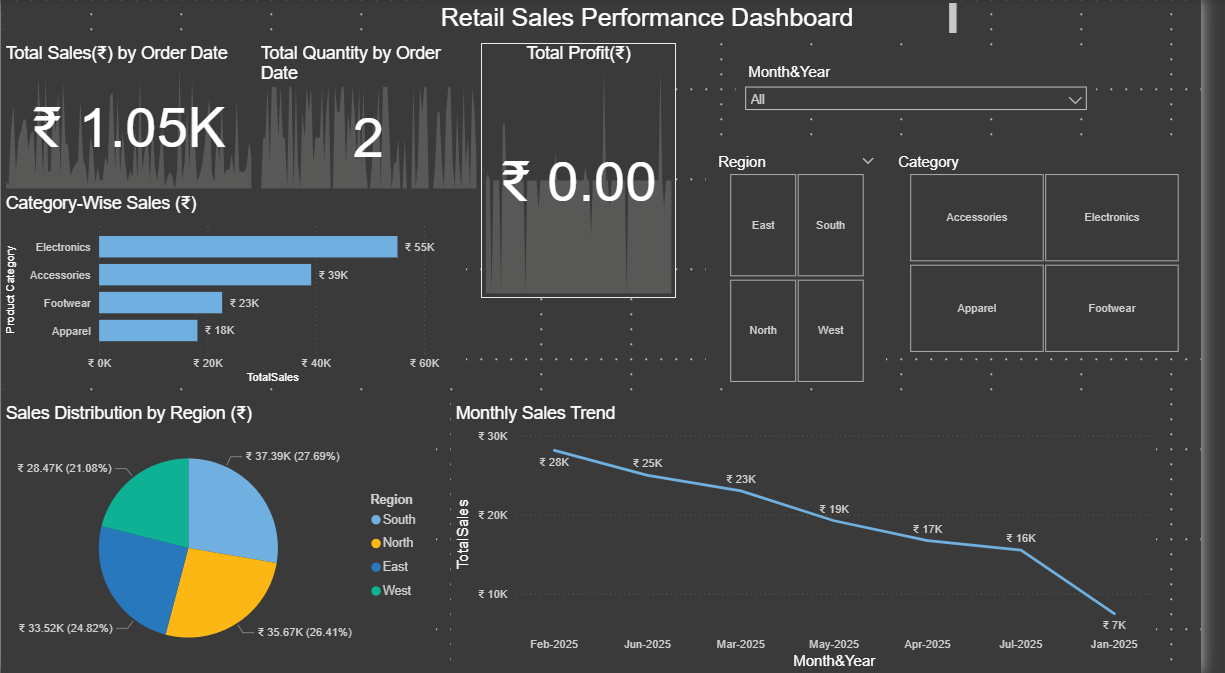
2️⃣ Retail Sales Data Analysis
Tools & Skills: Python (Pandas, Matplotlib, Seaborn), Power BI
Highlights:
- Cleaned and transformed sales data for analysis.
- Created visualizations to track sales trends and top products.
- Generated insights to optimize stock and marketing.
Screenshot:
3️⃣ E-Commerce SQL Project
Tools & Skills: MySQL, SQL Joins, Subqueries, Window Functions
Highlights:
- Designed intermediate to advanced SQL queries for sales insights.
- Analyzed customer behavior, top-selling products, and revenue trends.
- Provided business recommendations for better inventory planning.
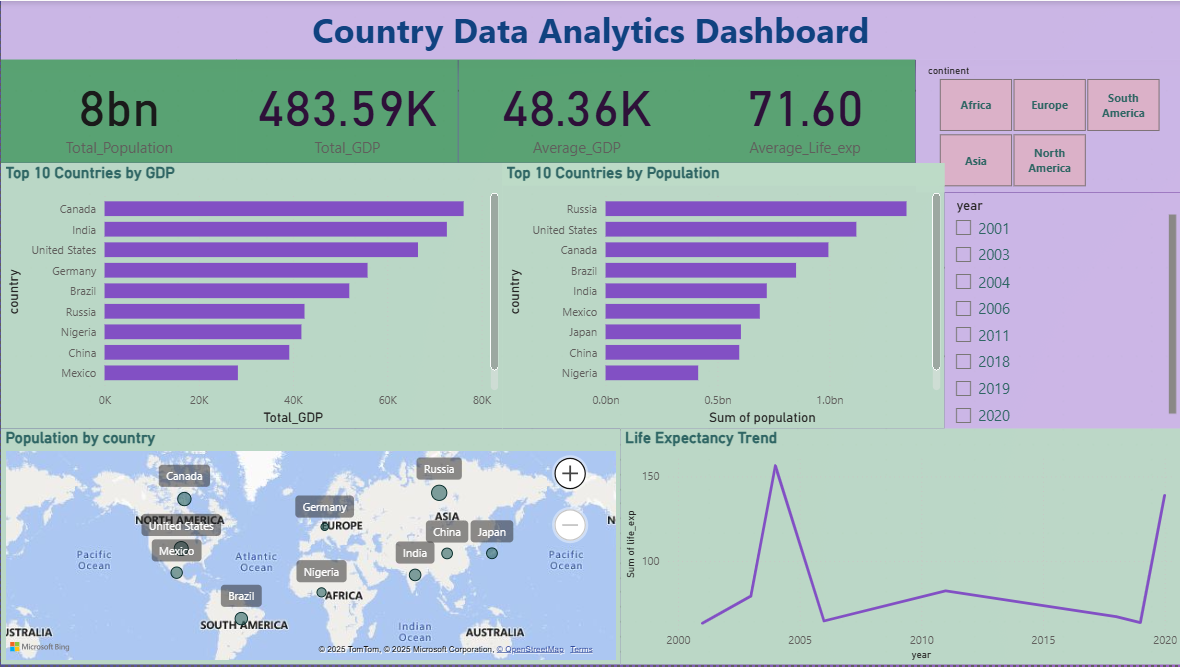
4️⃣ Country Data Power BI Dashboard
Tools & Skills: Power BI, Data Modeling, DAX
Highlights:
- Created an interactive dashboard for population, GDP, and life expectancy trends.
- Used slicers and filters for country/continent-level analysis.
- Designed professional and user-friendly reports.
Screenshot:
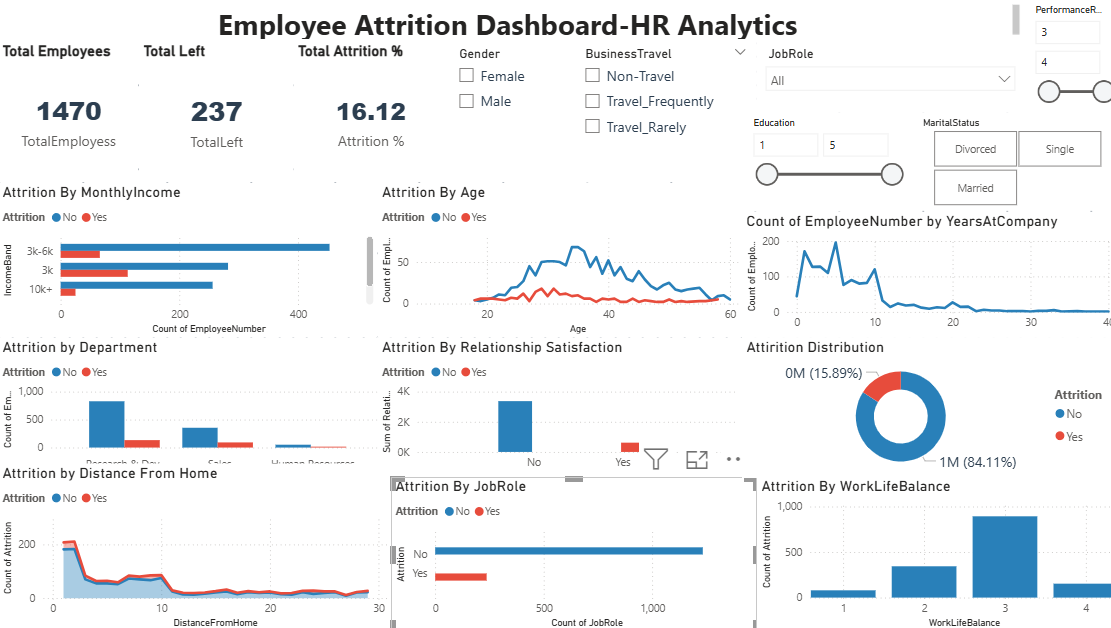
5️⃣ Employee Attrition Analysis
Tools & Skills: Python, Power BI, SQL
Highlights:
- Studied HR data to uncover key factors behind employee turnover.
- Built attrition prediction models.
- Designed an HR dashboard with attrition KPIs and demographic breakdowns.
Screenshot:
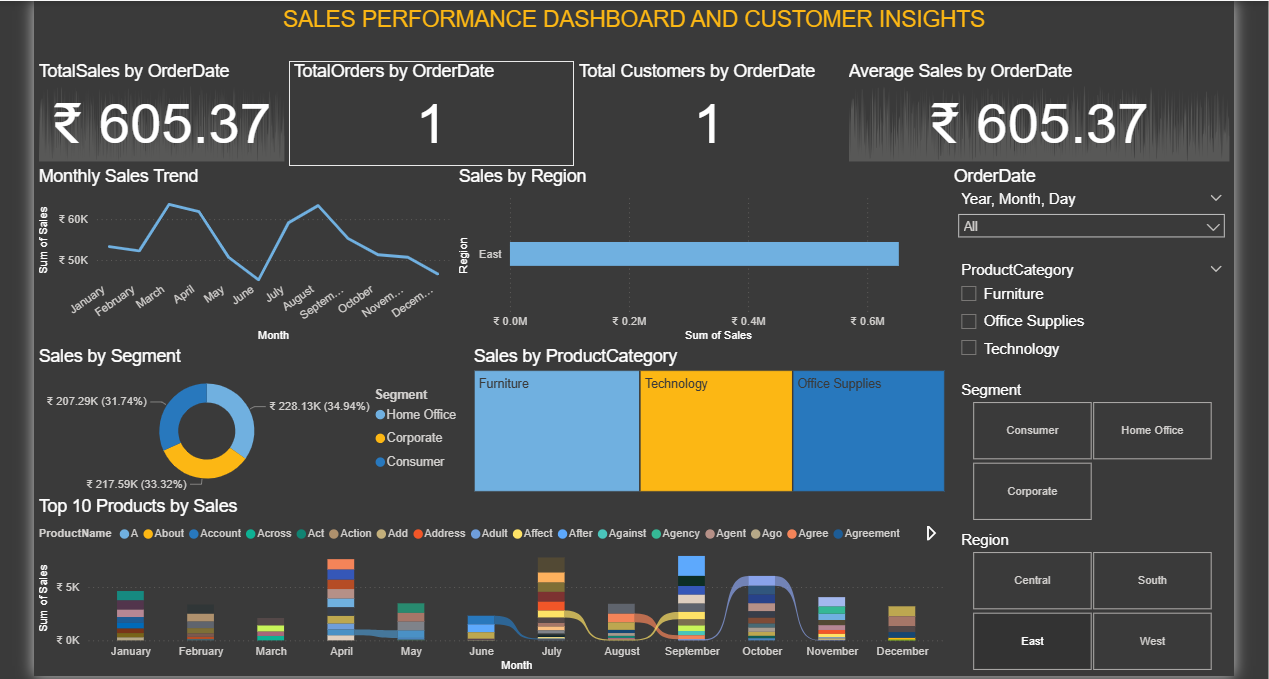
6️⃣ Sales Performance Dashboard
Tools & Skills: Power BI, DAX, Data Cleaning
Highlights:
- Built a sales performance dashboard with region, product, and category analysis.
- Used KPIs to track sales revenue and trends.
- Connected data sources and applied transformations.
Screenshot:
📂 Skills Summary
- Data Analysis Tools: Python, SQL, Power BI, Excel
- Libraries: Pandas, NumPy, Matplotlib, Seaborn, Scikit-learn
- Database: MySQL
- Data Visualization: Power BI Dashboards, KPI Cards, Interactive Filters
- Data Wrangling: Cleaning, Transformation, Aggregation
- Analytics: Exploratory Data Analysis (EDA), Business Insights, Predictive Modeling
📬 Contact
- Name: R. Nagarjuna
- Email: arjunravella108@gmail.com
- LinkedIn: linkedin.com/in/R-Nagarjuna
- Portfolio Website: ravellanagarjuna.github.io/Portfolio